Knowing the exact way users interact with your website is just as essential as knowing the number of visitors you get in today’s data-driven digital world. Heatmaps can be a very helpful tool in such cases. They reveal user behavior through graphics they show where users click, scroll, move, or get bored thus, helping you to optimize user experience (UX) in a very straightforward manner and with confidence.
Besides, heatmaps are the tool that businesses and marketers using CRO Forge leverage to discover the points of friction, check the correctness of the design decisions and, most importantly, increase the conversion rate by basing the decisions on real user data instead of guessing.
What Are Heatmaps?
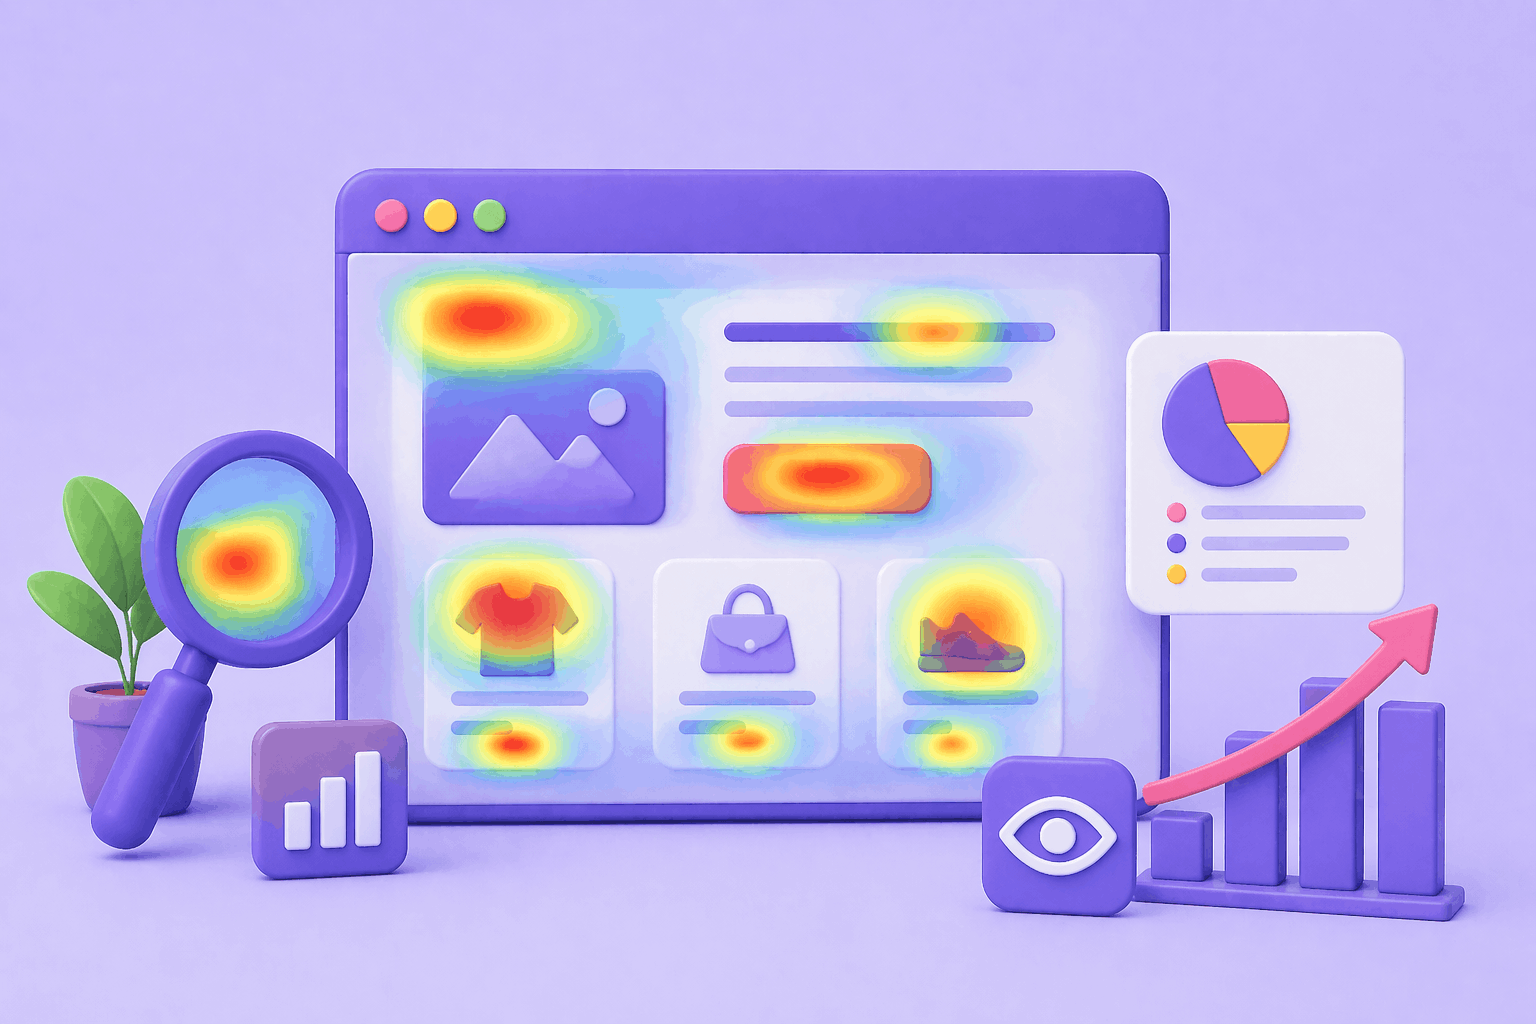
Heatmaps represent where and how users interact with a page. To illustrate the site areas where people focus their attention, they employ color scales, commonly from red (high activity) to blue (low activity). A heatmap allows you to make the guesswork of web user behavior a thing of the past by giving you instant, visual insights rather than traditional analytics reports.
Different Types of Heatmaps You Should Consider Using
1. Click Heatmaps
Click heatmaps point out the areas on a page that the visitors most frequently click on. Some of the things they help you to identify are:
- Popular buttons and links
- Parts of a page that people think should be clickable (but actually aren’t)
- CTAs such that people are not paying attention to
2. Scroll Heatmaps
Scroll heatmaps give you an idea of how far users scroll down the page. They can be your best friends for:
- Choosing the most appropriate place for CTAs
- Figuring out the parts of the content that the users don’t see
- Reshaping long landing pages and articles
3. Mouse Movement Heatmaps
Mouse movement heatmaps keep an eye on the position of the cursor, which is quite often aligned with the user’s gaze. They help you:
- Judge the level of interest in the content
- Spot misunderstanding or confusion in a user’s reaction
- Make improvements to content hierarchy
How Heatmaps Can Help in Enhancing User Experience
One can convert the behavior of website users into actionable insights of UX through heatmaps. Specifically, heatmaps:
- Enable you to spot user experience issues right away, recognition of layouts that are overcrowded or navigation that is confusing
- Help you optimize the positioning of CTA, locate the sites for the installation of the buttons where users will be most likely to see or click them
- Allow you to enhance the setting of the content, concentrating on the sections which are most important
- Give you the means to decrease bounce rates, changes that need to be made so that users are no longer getting away quickly
Instead of making a wild guess about users’ preferences, heatmaps reveal the exact picture of the events.
How to Use Heatmaps Effectively (Step-by-Step)
Step 1: Define Your UX Goal
First things, you make a decision on what you want to achieve:
- Get more sign-ups
- Enhance engagement on the product page
- Lower the rate of form abandonment
The goal you set will help you understand what kind of heatmap data you will need most.
Step 2: Analyze High-Traffic Pages First
You want to put your attention on:
- Landing pages
- Product or pricing pages
- Checkout or sign-up flows
These pages usually have the greatest effect on conversion.
Step 3: Look for Patterns, Not Just Colors
Resist the temptation to draw conclusions based on only a few seconds of looking at the color scatter on the heatmaps. Instead, ask yourself:
- Do users keep clicking on elements which are not clickable?
- Are crucial CTAs hidden under the fold?
- Are users skipping important sections of content?
Such patterns reveal UX issues, which figures alone cannot explain.
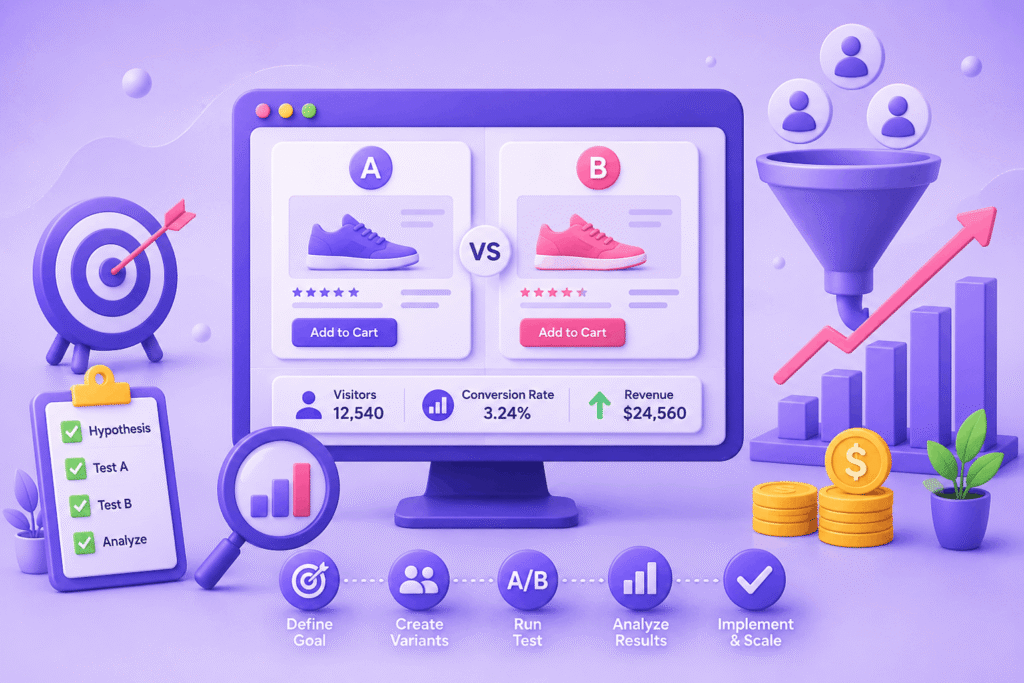
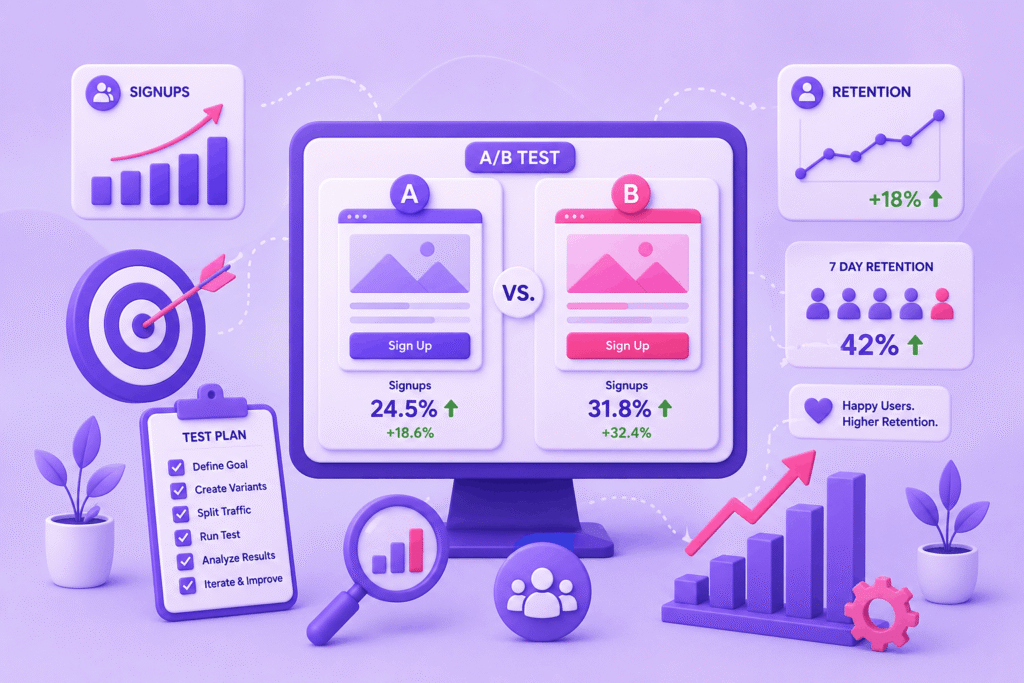
Step 4: Combine Heatmaps with A/B Testing
Heatmaps reveal to you the reality of the situation, whereas A/B testing shows you the results of the two versions. You can apply heatmap insights to:
- Come up with better test hypotheses
- Support the efficacy of design changes
- Make user experience a never-ending improvement process
Experimenting can be made easier and more efficient when you use CRO Forge to synchronize insights and experiments.
Common Heatmap Errors to Avoid
- Depending solely on heatmaps – It’s essential to use them in conjunction with analytics and testing
- Not considering mobile behavior – Heatmaps on mobile devices frequently show vastly different data
- Over-interpreting small data sets – It’s essential to have enough traffic before making conclusions
Heatmaps are incredibly useful, but it’s essential to keep things in context.
Heatmaps for Different Applications
- eCommerce Sites – Heatmaps can be used to optimize product image pages, pricing pages, and “Add to Cart” buttons
- SaaS Sites – Heatmaps can be used to optimize onboarding processes, feature pages, and sign-up forms
- Design Agencies – Heatmaps can be used to provide a clear visual explanation to clients to back up design choices
- Personal Sites – Heatmaps can be used to determine what content is truly resonating with visitors
Final Thoughts
Heatmaps really are among the easiest and most powerful tools to gain a deep understanding of your users’ behavior and thereby, enhance UX. They take the raw data, that most of the time is abstract, and change it into simple visual insights that help to make good decisions. In addition, when you experiment and perform A/B testing with the help of CRO Forge, heatmaps allow you to trade in your intuition for well-supported data in order to increase the effectiveness of your site, making your users happy with the overall experience and your conversions going up.